
DEEP GUIDE · ADVANCED
XLS Generation (@vxls)
Learn @vxls tables, formulas, and charts, preview and apply multi-sheet changes, and use pivots, formatting rules, and XLSX/PDF export.
VORA Chat and Tool Demo
XLS Generation (@vxls) — workflow demo
Learn @vxls tables, formulas, and charts, preview and apply multi-sheet changes, and use pivots, formatting rules, and XLSX/PDF export.Choose a real request from this guide and preview the flow from input to result.
This demo stays in your browser; it sends, saves, and charges nothing.
Send a request to see the processing flow and output format for this tool.
@vxls Create a monthly sales table with total formulas, currency formatting, and a bar chart
- 1Check request scope
- 2Create draft or session
- 3Prepare dedicated workspace
- 4Return new-tab URL
VORA chat input@vxls Create a monthly sales table with total formulas, currency formatting, and a bar chart
https://guide.vora.im/en/tools/xls-generation/#workspace-demoOpen in a new tab ↗ ⓘ Check the live link card in VORA for its expiry. The preview shows the Korean interface.
Live results vary with the source material, request, and time of use.
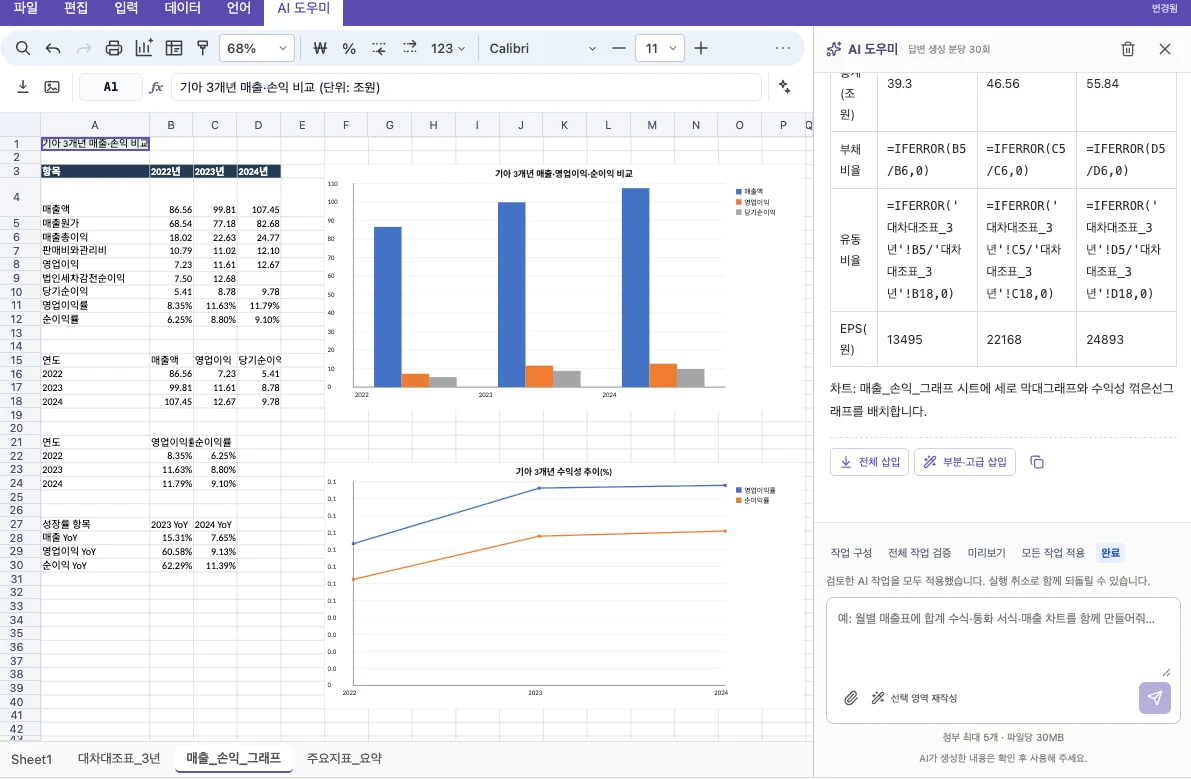
01. An editor for tables, formulas, and charts
XLS Generation opens an AI spreadsheet editor with @vxls. Prepare tables, formulas, charts, and multi-sheet changes, review their preview, then apply them. You can also open and edit existing XLSX files.
02. Start with @vxls
| Chat input or action | What opens |
|---|---|
| @vxls | An empty editor when there is no request, background, or attachment. |
| @vxls Create monthly totals and charts from the sales data above | AI work starts with the request and conversation background. |
| @vxls Turn the data in https://example.com/reference.pdf into a table | An accessible HTTPS file is read as a reference before AI work starts. |
| File → Open, then select XLSX | Opens the existing workbook for direct cell, formula, and sheet editing. |
03. Source data and effective requests
Specify source ranges, column names, units, periods, calculations, and output locations. Distinguish real data from examples and include number formats and sheet names.
- @vxls Create a monthly sales table with total formulas, currency formatting, and a bar chart
- @vxls Calculate profit margins from selected sales and costs and summarize them in a new sheet
- @vxls Create a regional pivot grouped by year and month with a connected pivot chart
04. Cells, sheets, and range selection
- Enter an address such as B5:D12 in the name box to select a range.
- Switch sheets with the bottom tabs and inspect values and formulas in the formula bar.
- Use the cell, table, chart, formula, data, and formatting tools.
- Adjust row and column sizes and number formats, then save XLSX with Ctrl/Cmd+S.
05. Selection questions and references
Select the source range and commit any active cell edit before asking. AI uses the sheet, selection, values, and formula results captured at question time. Keep the source range and insertion destination distinct.
06. Preview and apply AI work
- Choose full insertion or partial/advanced insertion from the response.
- Choose the current cell, below selection, replace selection, or a new sheet.
- Review actual sheet addresses, overwrite counts, formulas, charts, and rules in the AI work preview.
- Apply all tasks to commit the validated changes together. One undo reverses the entire operation.
07. Create and verify formulas
Use supported functions such as SUM and IFERROR and check cross-sheet, absolute, and relative references. Press F4 while entering a formula to cycle reference styles, and search function help for supported functions and examples.
08. Create and edit charts
Include source ranges, chart type, axis titles, units, and legends in the request. Use Insert → Create/edit chart to adjust types and series, and resize sheet charts with their edge handles.
09. Formatting rules, validation, and pivots
- Conditional formatting: request threshold highlights, duplicate markers, data bars, or color scales.
- Validation: specify lists such as In progress/Done, allowed numbers or dates, and error messages.
- Pivots: specify source ranges, rows, columns, values, filters, and aggregations such as sum or average.
- Set up slicers, timelines, and formula tracing through the editing menus.
10. Size limits and compatibility
AI insertion supports up to 2,000 rows and 100 columns per block, 10,000 cells overall, and 16 sheets. Review any excluded rows, cells, or features and their references, then split the work. These are AI insertion limits, not overall editor size limits.
11. XLSX, PDF, and recovery
- Download an editable workbook with XLSX Save or Ctrl/Cmd+S.
- PNG captures the current sheet view; PDF and print use selected ranges, used areas, or all sheets.
- Check VORA save confirmation; download the XLSX first if saving fails.
- Restore browser-stored drafts from File → Document recovery, and keep separate copies of important files.
12. Troubleshooting and final checks
| Situation | Next step |
|---|---|
| Range or overwrite conflict | Check preview addresses and protected, merged, or array-formula ranges. |
| Duplicate new sheet name | Request a different name. |
| Unexpected formula result | Check numbers versus text, date/percentage formats, and reference ranges. |
| Unexpected chart or pivot | Review source columns, aggregation, filters, and refresh. |
| Expired link | Save the open workbook as XLSX, then request a fresh @vxls link in VORA. |
Finish in this order: source data, calculation checks, work preview, apply all, save and reopen. Screenshot values are examples, not evidence for your own work.