
DEEP GUIDE · ADVANCED
K-Think Opinion Simulator (@vresearch)
A 24-chapter advanced guide to the K-Think workbench for analyzing acceptance, resistance, evidence, and risks with a virtual Korean population.
01. Service overview
K-Think estimates who supports or resists an idea, which life context and evidence shape that judgment, and what conditions could change it. Instead of one generic AI answer, it builds a sample of virtual Korean personas and organizes their reactions into distributions, group analysis, knowledge and evidence graphs, and a report.
- Input: a question, optional source documents, and population filters such as age, region, occupation, or gender.
- Process: sample personas, gather context, combine document evidence, simulate reactions, analyze groups, and build the report.
- Output: stance distribution, group reactions, issues, risks, social metrics, graphs, recommendations, and a PDF report.
02. Access and environment
Use a desktop browser for the three-column workbench. Tablets are supported with less chart space; smartphones show a prompt to continue on a PC.
- Launch links can be bound to the first browser that opens them. A different browser or device may be denied.
- Direct access may be available under operating rules, with limits on concurrent sessions, daily runs, persona count, and simulation mode.
- A waiting screen means the concurrent-session limit is full. Keep the window open to connect automatically.
03. Workspace layout
Enter the question, files, and population settings in the left rail; explore nine result tabs in the center; and keep the current result, evidence, logs, and group reactions visible in the right rail. The top bar controls language, job status, stop/reset, and new analysis.
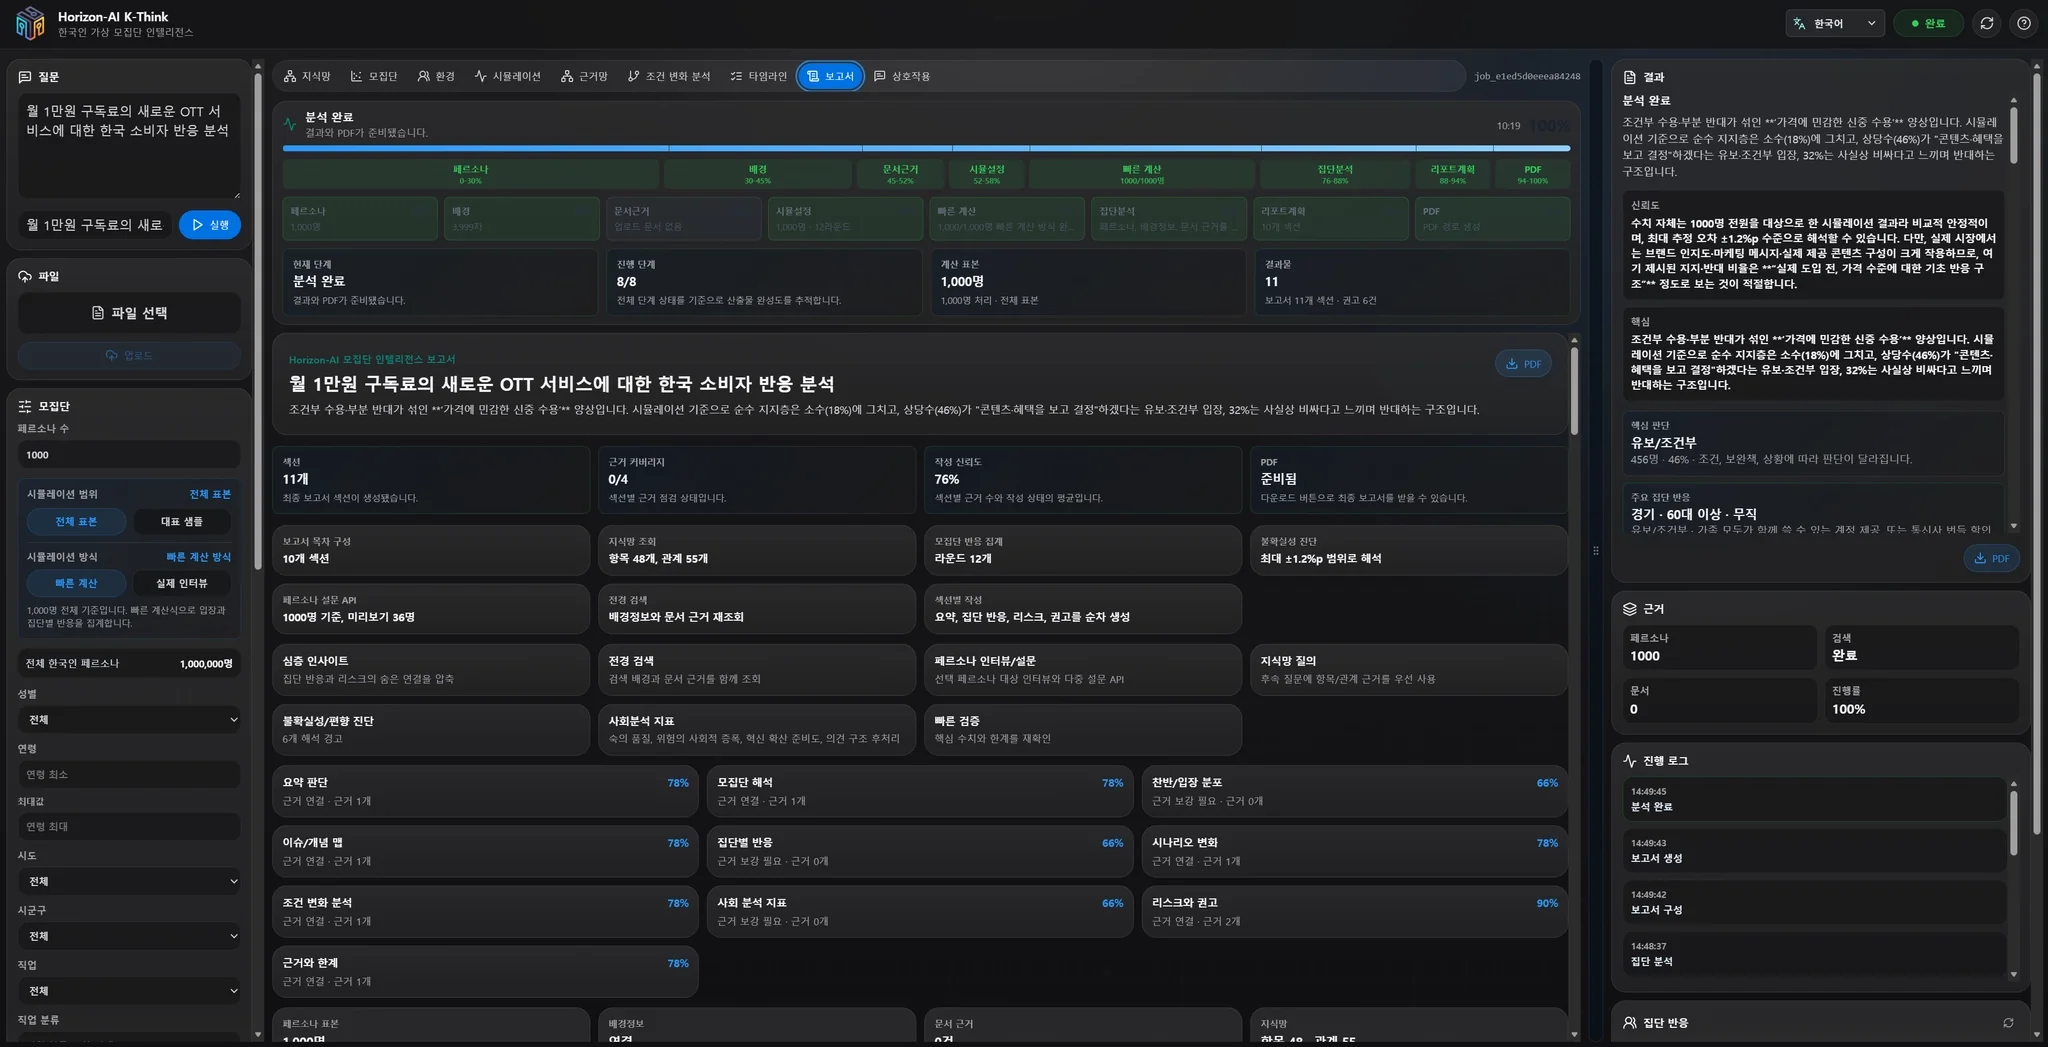
04. Run an analysis in five steps
- Select the language for the final output.
- Write one concrete decision question and, if useful, a distinctive report title.
- Upload optional source files and wait until extraction is complete.
- Set persona count, full or representative sample, fast calculation or real interview, and population filters.
- Run the job, follow progress in Timeline, then read the report together with the underlying tabs.
05. Question panel
K-Think classifies questions as support/opposition, choice, current-opinion structure, or direct evaluation. Specify the decision, timing, target group, price or burden, and ask one judgment at a time.
| Question | Result focus |
|---|---|
| Should this policy be introduced? | Support, oppose, undecided, and each side’s reasons |
| Will option A or B be accepted? | Preference and switching conditions |
| What is the current opinion structure? | Issues, group differences, and diffusion factors |
06. File panel
Upload policy text, plans, press releases, minutes, or other evidence. Multiple files are supported. After transfer, the server extracts their text and connects it to the analysis and evidence graph.
- Select files and check the count and total size.
- Remove unwanted items, then start the upload.
- Wait for queued → transferring → registering → complete. A failure includes its reason.
07. Population panel
Build a sample from a Korean synthetic-persona table of roughly one million records. Set at least 10 personas; the upper bound depends on the plan and operating environment.
- Full sample simulates every selected persona; representative sample keeps the broader distribution while using a smaller simulation subset.
- Fast calculation scales to large samples; real interview produces richer individual answers but takes longer and has a lower cap.
- Filters include gender, age, province, district, occupation, education, marital status, household, housing, military service, major, and related classifications.
08. Pipeline and history
The eight stages are persona sampling, background research, document evidence, simulation setup, persona-opinion simulation, group analysis, report planning, and PDF generation. Persona simulation is usually the longest stage.
History stores the question summary, time, and state in the current browser. Selecting an item restores its charts and report. Export important work because history does not automatically move to another browser or device.
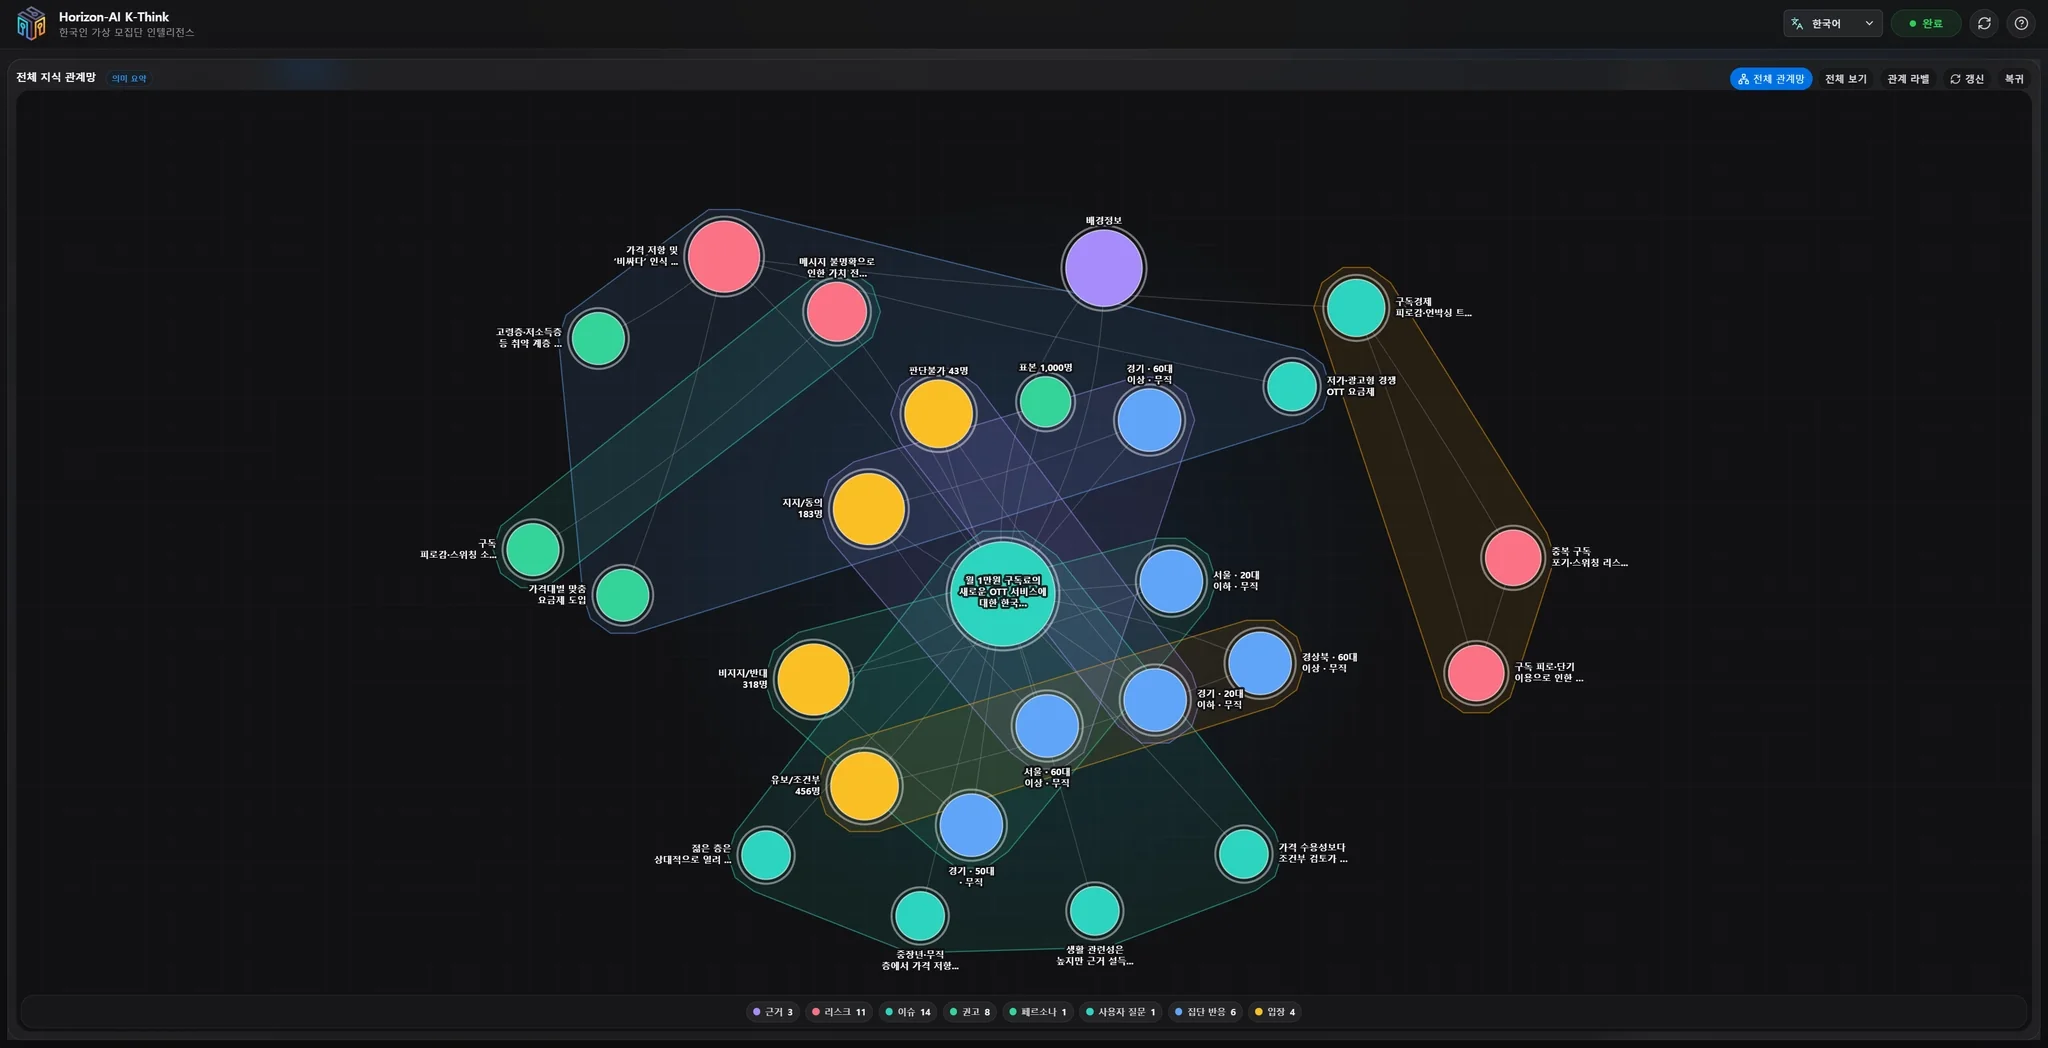
09. Knowledge Graph tab
The Knowledge Graph connects concepts extracted from the question, documents, and persona reactions. Switch between overview and focused views, then zoom, pan, fit, or reset the graph. Selecting a node opens its description, relationships, supporting evidence, and related persona responses.
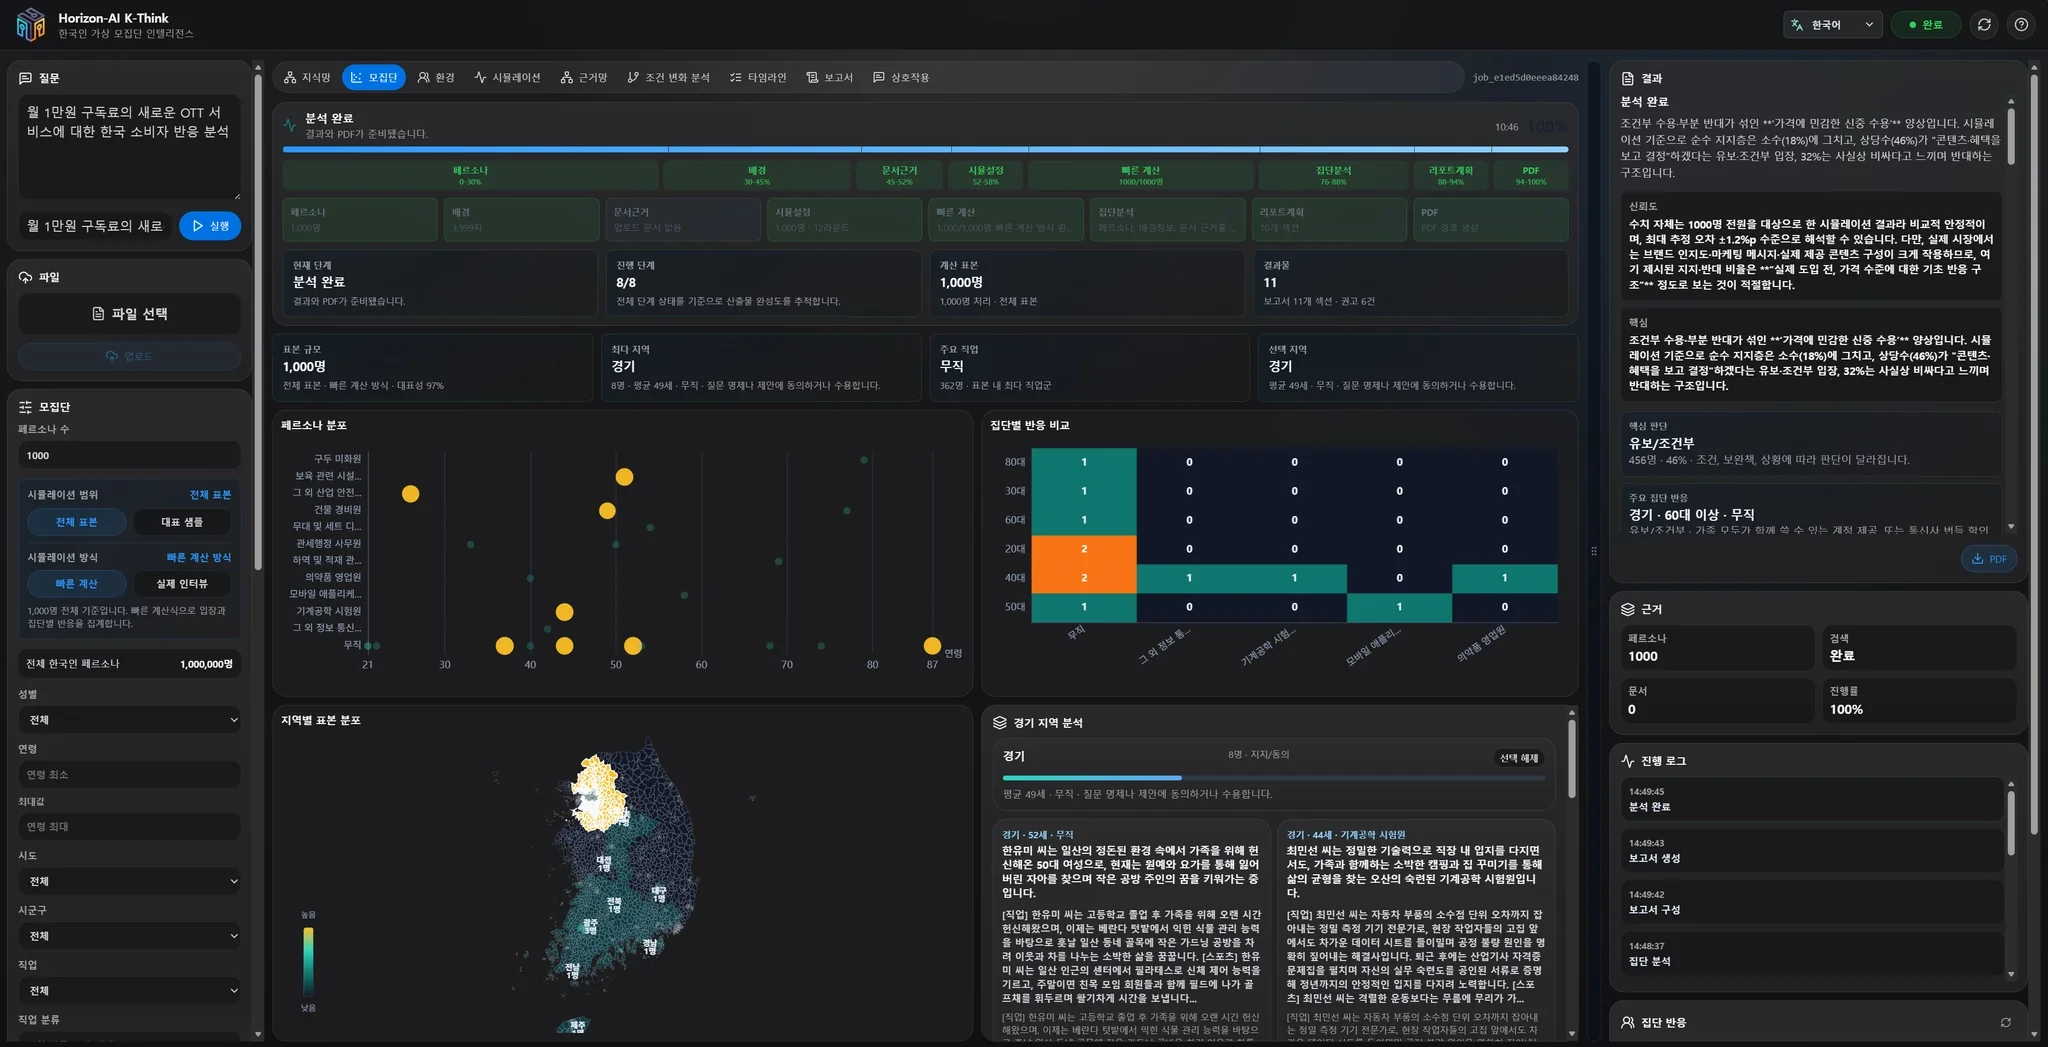
10. Population tab
Inspect whether the sample matches the intended audience before interpreting opinions. Insight cards summarize quality; maps and demographic charts show regional, age, gender, occupation, and other distributions. Small segments can fluctuate, so always read percentages with counts.
11. Environment tab
Review the information and social environment in which virtual agents make judgments. Environment settings describe participants, channels, rounds, exposed information, and interaction rules. Agent cards reveal background, interests, expertise, initial stance, concerns, evidence, and possible persuasion conditions.
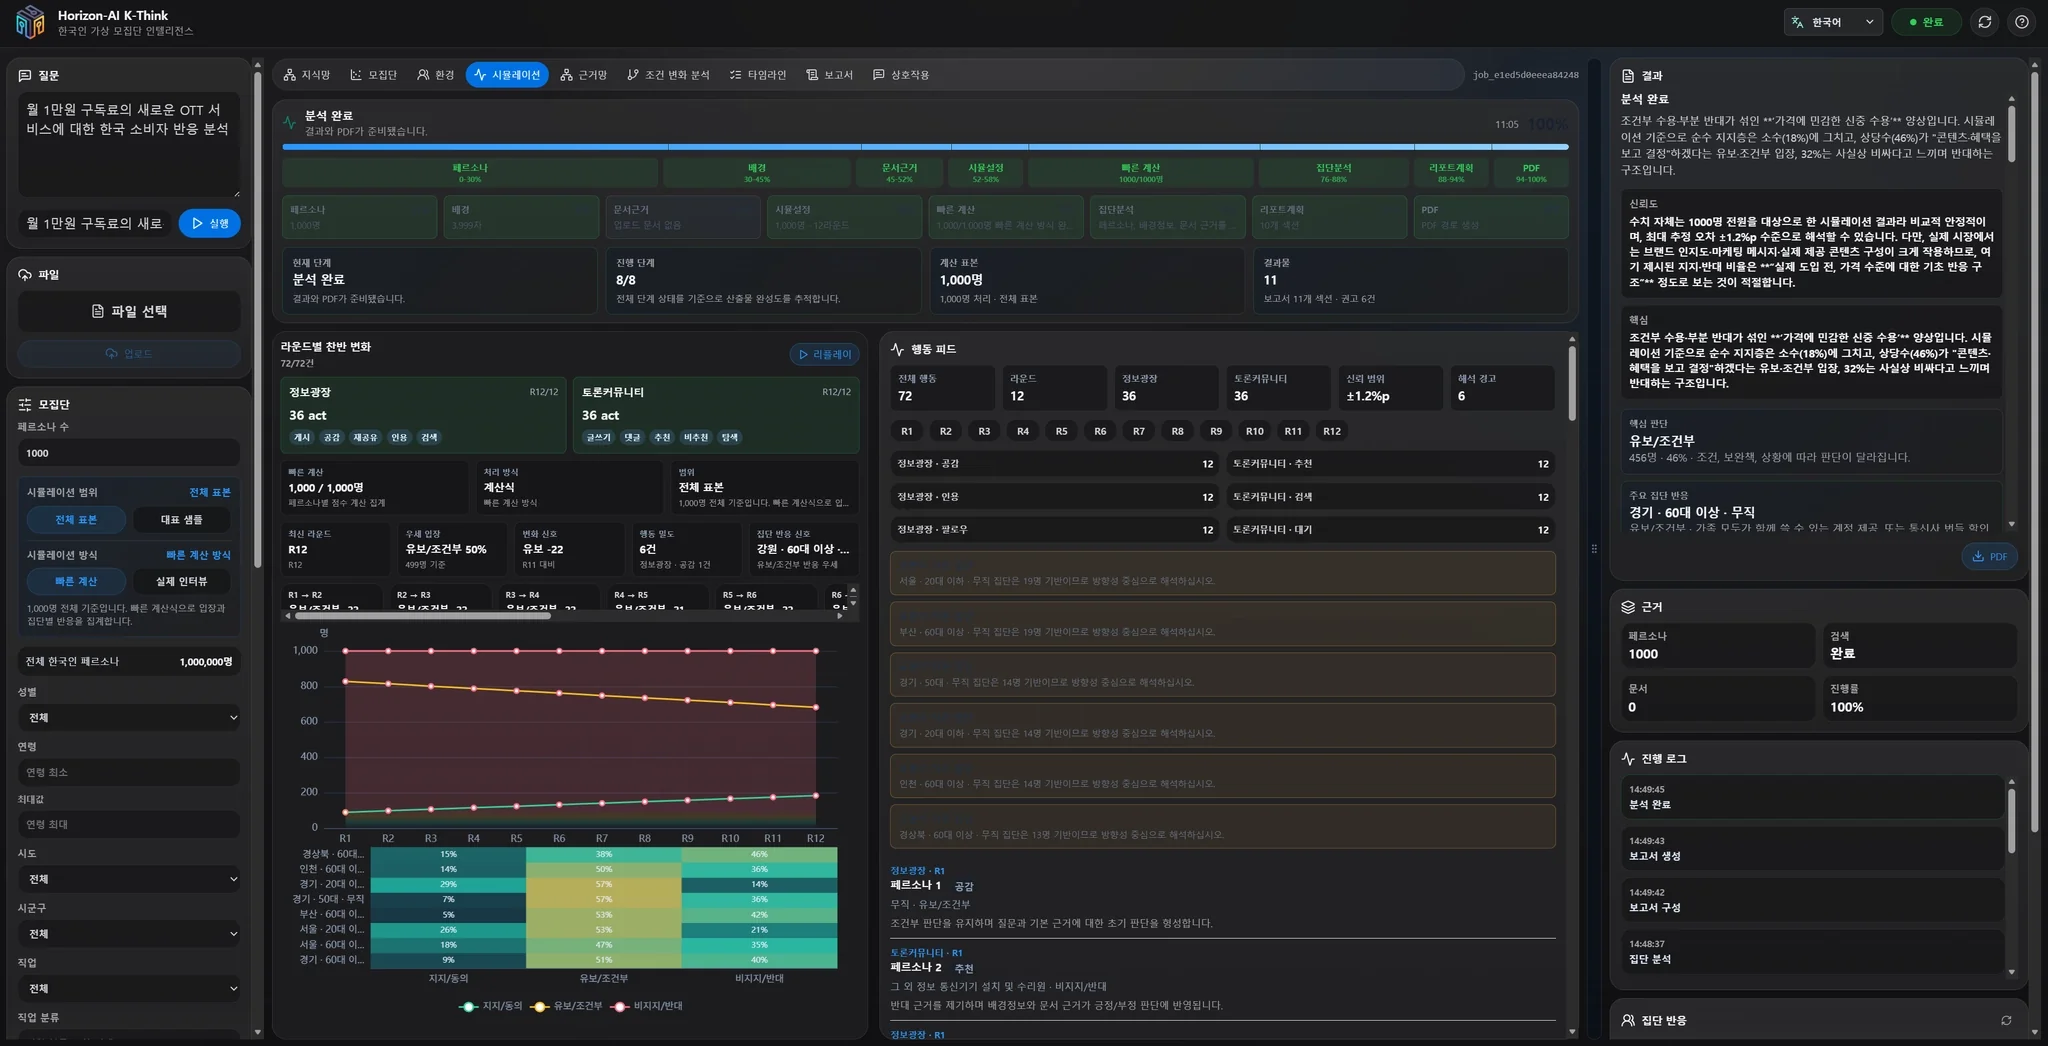
12. Simulation tab
Follow support, opposition, and undecided shares across rounds and channels. Summary metrics show the current distribution and movement; switching signals explain what changed a judgment; the activity feed shows representative virtual reactions.
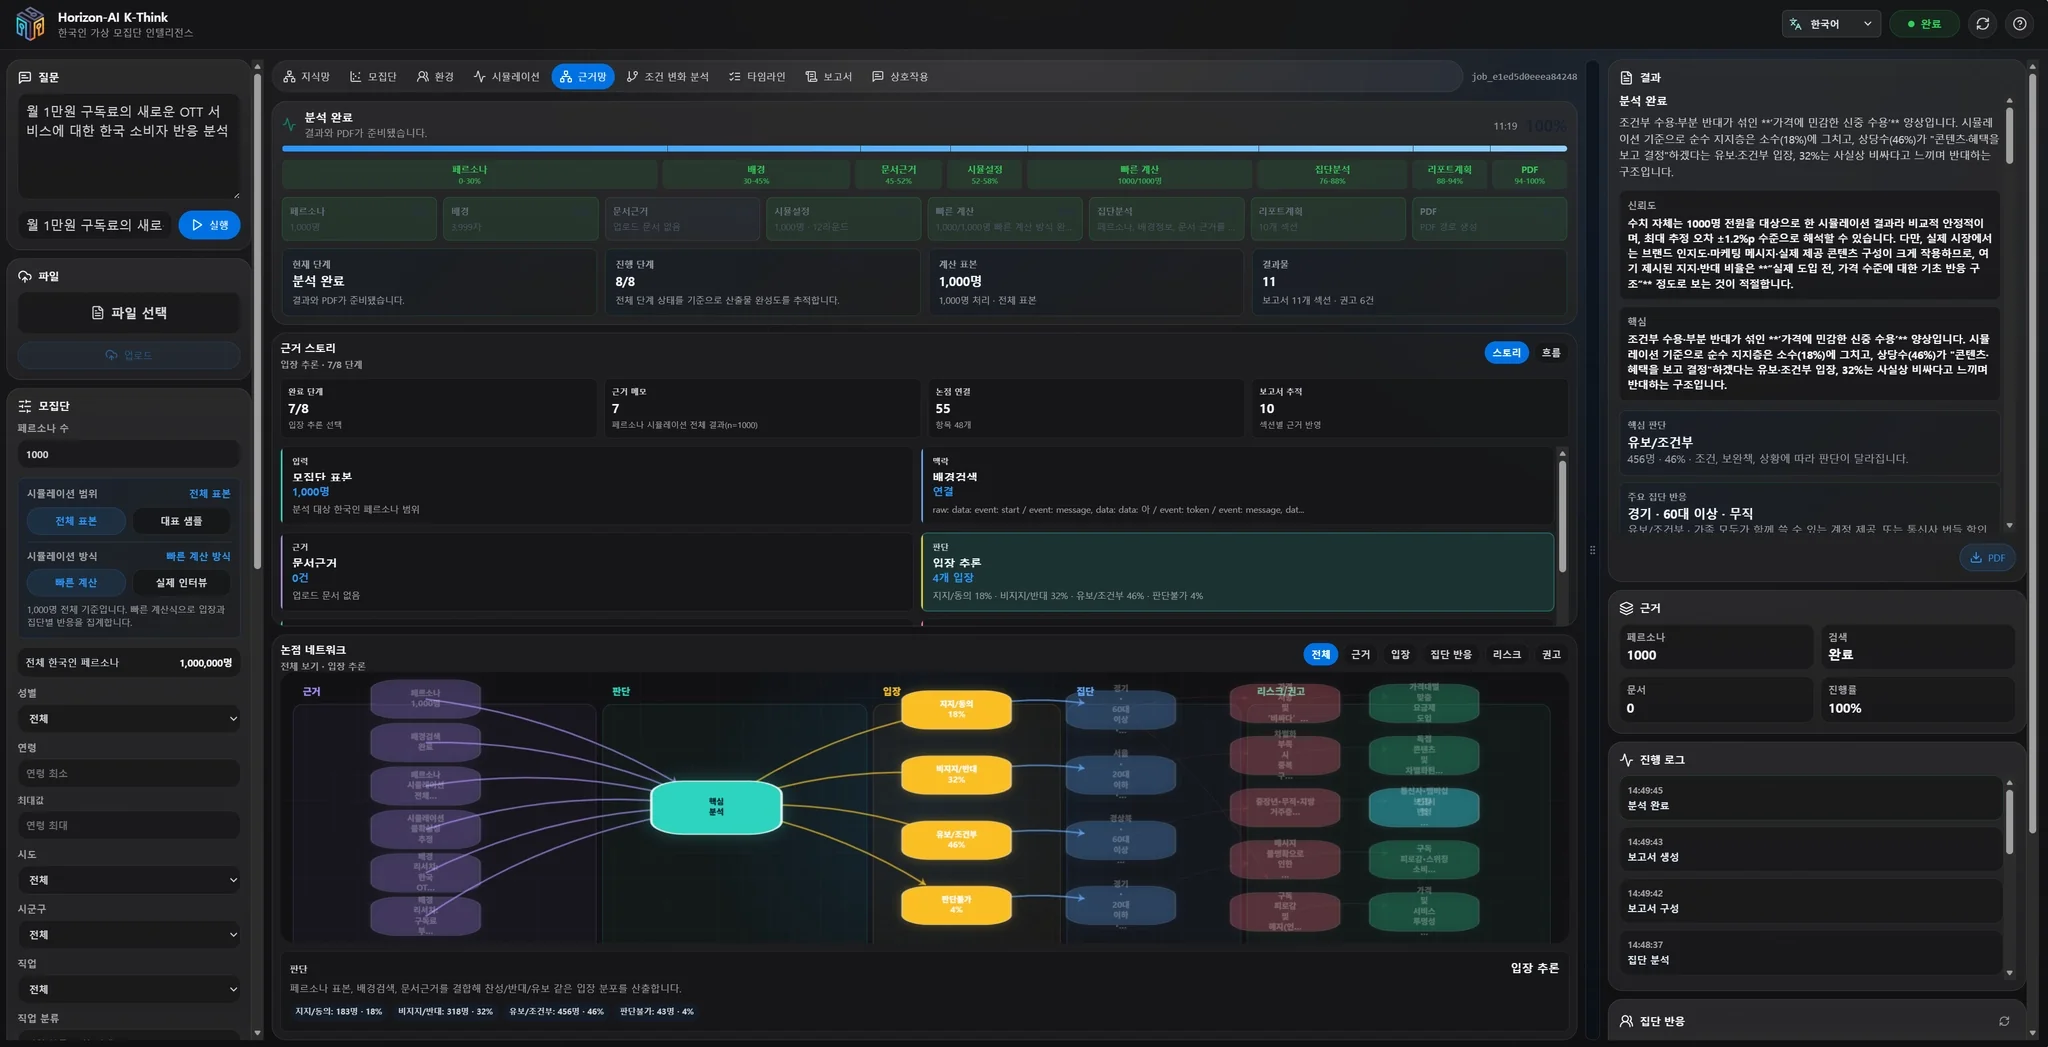
13. Evidence Graph tab
Trace how background facts, uploaded documents, and persona reactions lead to conclusions. The evidence story shows the chain; the issue network connects supporting, opposing, risk, and recommendation arguments.
14. Condition Change Analysis tab
Test how the current judgment changes when four question-specific levers—such as cost, benefit, trust, and risk—move. The tab updates the verdict, threshold conditions, and sensitivity.
15. Timeline tab
Timeline lists the start, completion, waiting, and failure events for all eight stages. Use it to identify the current bottleneck and diagnose document-processing or PDF-generation failures. Record the job ID, failed stage, and message when requesting support.
16. Report tab
A live draft fills while analysis runs. The final report usually covers executive summary, population and method, stance distribution, group reactions, evidence, risks, switching conditions, and recommendations.
- Check each section’s linked evidence instead of reading recommendations in isolation.
- Use confidence and quality signals to locate weak samples, sparse evidence, or remaining uncertainty.
- Confirm the analysis is complete before quoting or sharing the report; draft text can still change.
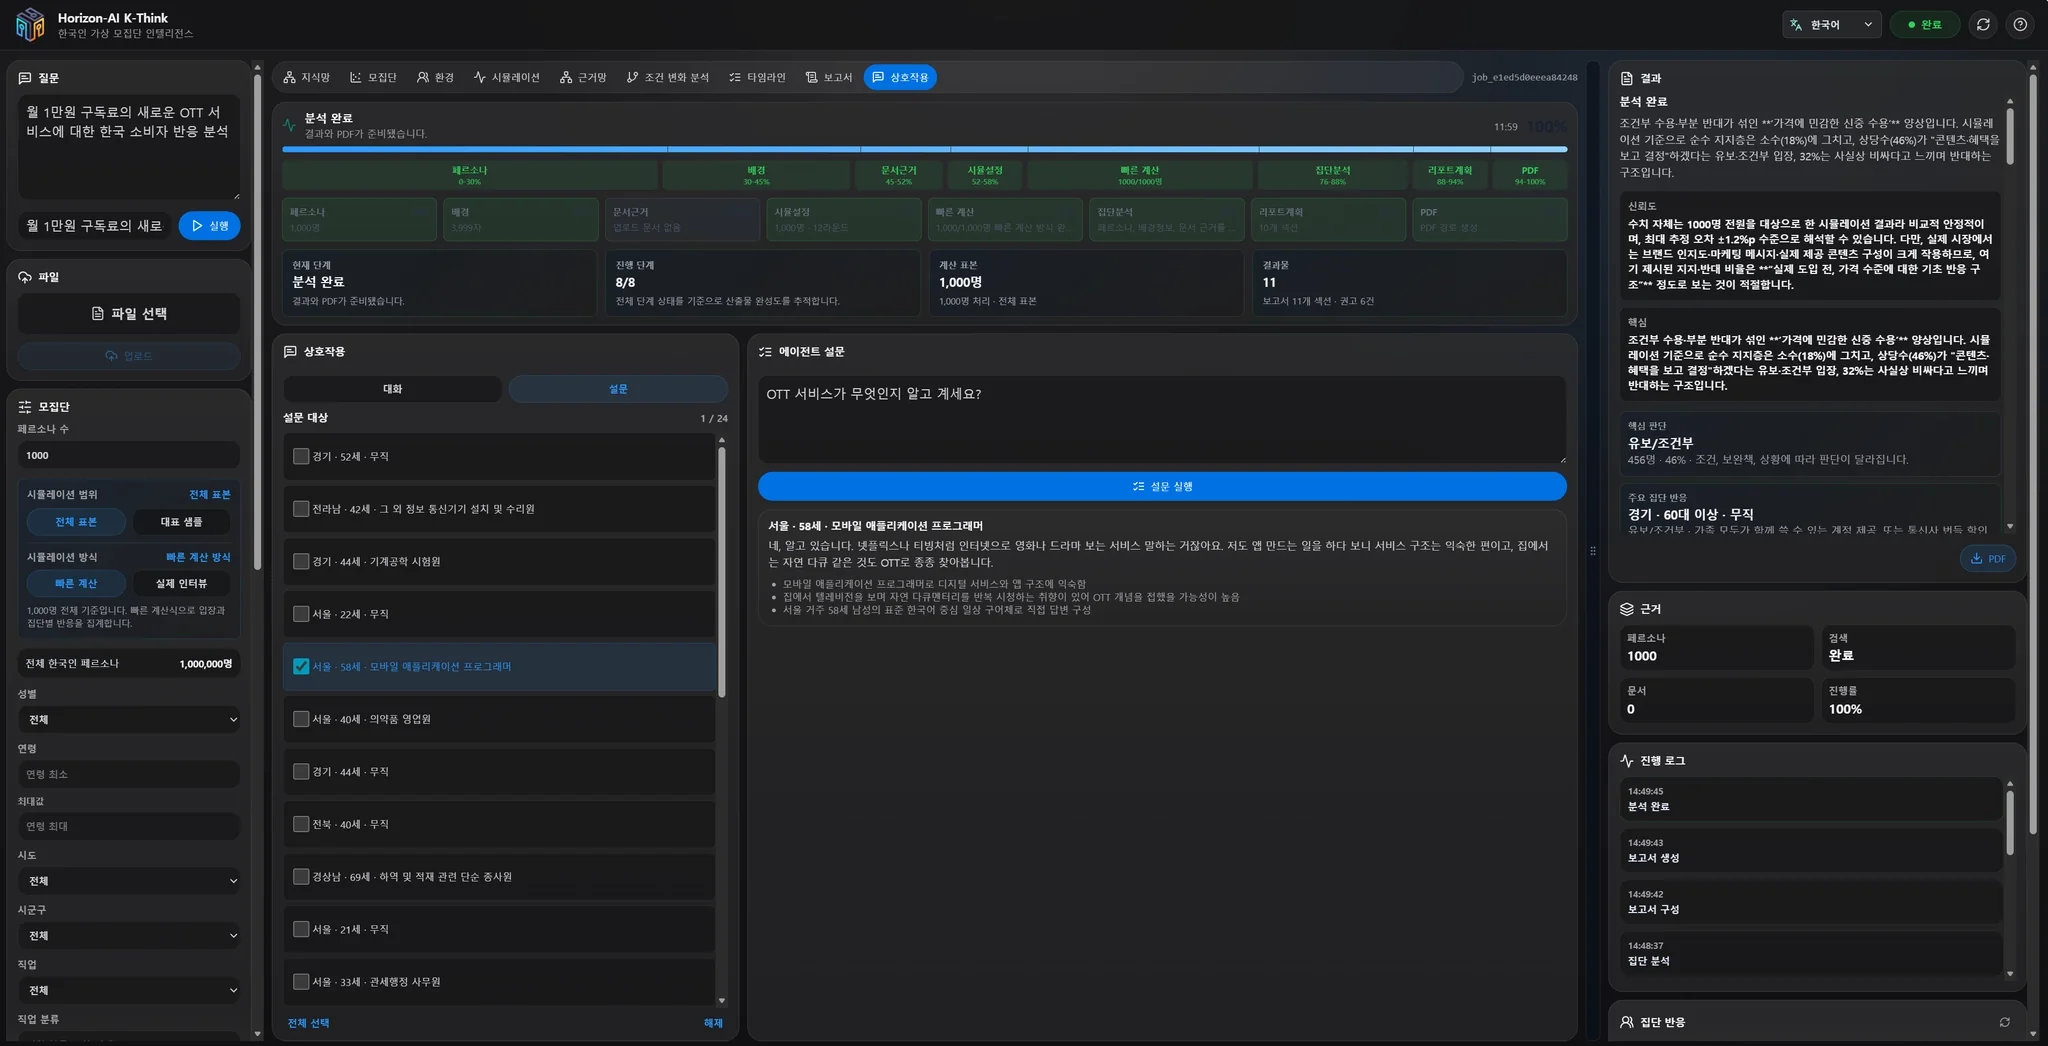
17. Interaction tab
Ask follow-up questions of the simulated population. Conversation mode explores concerns, reasons, and persuasion points; Survey mode compares response distributions for a clear item with non-overlapping choices.
18. Right-side Results panel
| Panel | Purpose |
|---|---|
| Results | Stance distribution, headline finding, risks, and recommendations |
| Evidence | Sources, documents, persona responses, and confidence for the current selection |
| Progress log | Detailed pipeline events and errors |
| Group reactions | Segment-level stances and distinguishing features |
19. Reading the metrics
Scores are comparative signals within the same question and conditions, not universal grades. Small differences near a grade boundary can reverse with sampling changes; read score, grade, sample, and evidence together.
- Social acceptance: support, legitimacy, feasibility, and gaps between groups.
- Deliberation quality: evidence diversity, mutual understanding, specificity, and extreme claims.
- Social amplification of risk: whether risk perception can grow through groups and channels.
- Innovation diffusion readiness: early adopters, observability, understanding, and adoption barriers.
- Opinion structure and polarization: camp distance, undecided share, cohesion, and switching potential.
20. Export
After completion, download a PDF or use SAVE to VORA. The PDF fixes the question, conditions, major charts and metrics, evidence, risks, and recommendations into a shareable report.
- Put scenario, date, and conditions in the title or filename.
- When sharing externally, disclose that it is a synthetic-persona simulation and include the analysis conditions.
- Use PDF or VORA storage for long-term retention rather than browser-only history.
21. Limits and plans
Concurrent sessions, daily runs, persona and representative-sample caps, real interview, file upload, and storage depend on the launch method and plan. Disabled controls and the notice shown in the current session are the applicable limits.
22. Troubleshooting
| Symptom | What to check |
|---|---|
| Launch denied | Use the first browser/device or request a new link if expired. |
| Waiting screen | The concurrent limit is full; keep the window open. |
| File missing from evidence | Confirm upload and extraction completed, then run a new analysis. |
| Run takes too long | Check the Timeline stage, persona count, and whether real interview is selected. |
| Empty or odd chart | Check overly narrow filters, sample count, and representativeness. |
| PDF fails | Confirm completion and record the job ID and Timeline error. |
23. Interpretation cautions
- Synthetic personas are not real respondents and do not predict election or market shares.
- Question wording, documents, filters, sample size, and mode all affect the result.
- Large percentage gaps in tiny segments may be sampling noise.
- Graph links and AI summaries are analytical clues, not verified facts or causal proof.
- Cross-check high-stakes decisions with real research, expert review, and current statistics.
24. Glossary
| Term | Meaning |
|---|---|
| Synthetic persona | A virtual character with demographic and life context; not a real person. |
| Eligible population | All records that pass the selected filters. |
| Sample | The personas actually used in this analysis. |
| Representativeness | How well sample size and distributions reflect the eligible population. |
| Representative sample | A smaller simulation subset that preserves the broader sample distribution. |
| Fast calculation | A scalable mode that computes reactions from attributes and the question frame. |
| Real interview | A mode that generates an individual virtual interview for each persona. |
| Switching condition | A condition combination that moves the current stance or verdict. |