
K-Think Opinion Simulator
Simulate public opinion with AI personas
VORA Chat and Tool Demo
K-Think Opinion Simulator — workflow demo
Simulate public opinion with AI personasChoose a real request from this guide and preview the flow from input to result.
This demo stays in your browser; it sends, saves, and charges nothing.
Send a request to see the processing flow and output format for this tool.
@vresearch Simulate Korean public opinion on a large-scale development project near Seongsu Station
- 1Check request scope
- 2Create draft or session
- 3Prepare dedicated workspace
- 4Return new-tab URL
VORA chat input@vresearch Simulate Korean public opinion on a large-scale development project near Seongsu Station
https://guide.vora.im/en/tools/k-think-opinion-simulator/#workspace-demoOpen in a new tab ↗ ⓘ The live analysis link is valid for one hour.
Live results vary with the source material, request, and time of use.
What is the K-Think Opinion Simulator tool?
A tool that simulates public opinion on social questions by leveraging a database of approximately 1 million Korean personas (based on NVIDIA Nemotron-Personas-Korea).
It's not meant to replace actual surveys, but rather an analysis environment for quickly checking decision hypotheses and discovering risk signals before research, announcements, or product launches.
Centered on the question you ask, up to 1,000 AI personas — configured by conditions like gender, age, region, occupation, education, household type, etc. — exchange information and take a stance — for, against, or undecided. The changes can be tracked round by round, and with What-if experiments, you can change conditions like message clarity or evidence strength to predict shifts in acceptance.
The analysis results are organized into a PDF report including a knowledge graph, evidence network, segment analysis, and risk recommendations.
When can you use it?
The K-Think Opinion Simulator is especially useful in these situations.
- When you want to gauge in advance the acceptance of new public policies or system changes
- When you want to explore differences in opinion across regions, generations, or occupational groups
- When you want to pre-verify the effectiveness of ad messages or campaign copy
- When you want to test market response to new product concepts, pricing, or benefit conditions
- When you want to review the potential for an issue to spread and response strategies for sensitive topics like safety, cost, privacy, fairness, or regional conflict
- When you want to refine hypotheses, question direction, or segment definitions before actual surveys
- When you want to quickly generate research report drafts and structure the evidence
For example, you can naturally ask "@vresearch Simulate Korean public opinion on a large-scale development project near Seongsu Station", "@vresearch Analyze how generational and regional reactions might differ on a new carbon tax policy", or "@vresearch Simulate whether this campaign message will actually work for the Korean public". The AI will then use this tool to create an analysis session and provide a link to the external K-Think page.
How to use it
This tool only works when you enter the @vresearch trigger keyword first, followed by the question you want to analyze.
The format is as follows:
@vresearch + [Social question · policy · message to analyze]
Here are some examples:
- Policy acceptance: "@vresearch Simulate Korean public opinion on a large-scale development project near Seongsu Station"
- Segment reaction analysis: "@vresearch Analyze how generational and regional reactions might differ on a new carbon tax policy"
- Pre-verifying messages: "@vresearch Simulate whether this campaign message will actually work for the Korean public"
- New product concept test: "@vresearch Analyze Korean consumer reactions to a new OTT service priced at ₩10,000/month"
Result screen preview
K-Think analysis is provided through 6 visualizations. Each screen can be freely navigated by switching tabs within the same analysis session.
See the Korean section above for the actual screen previews.
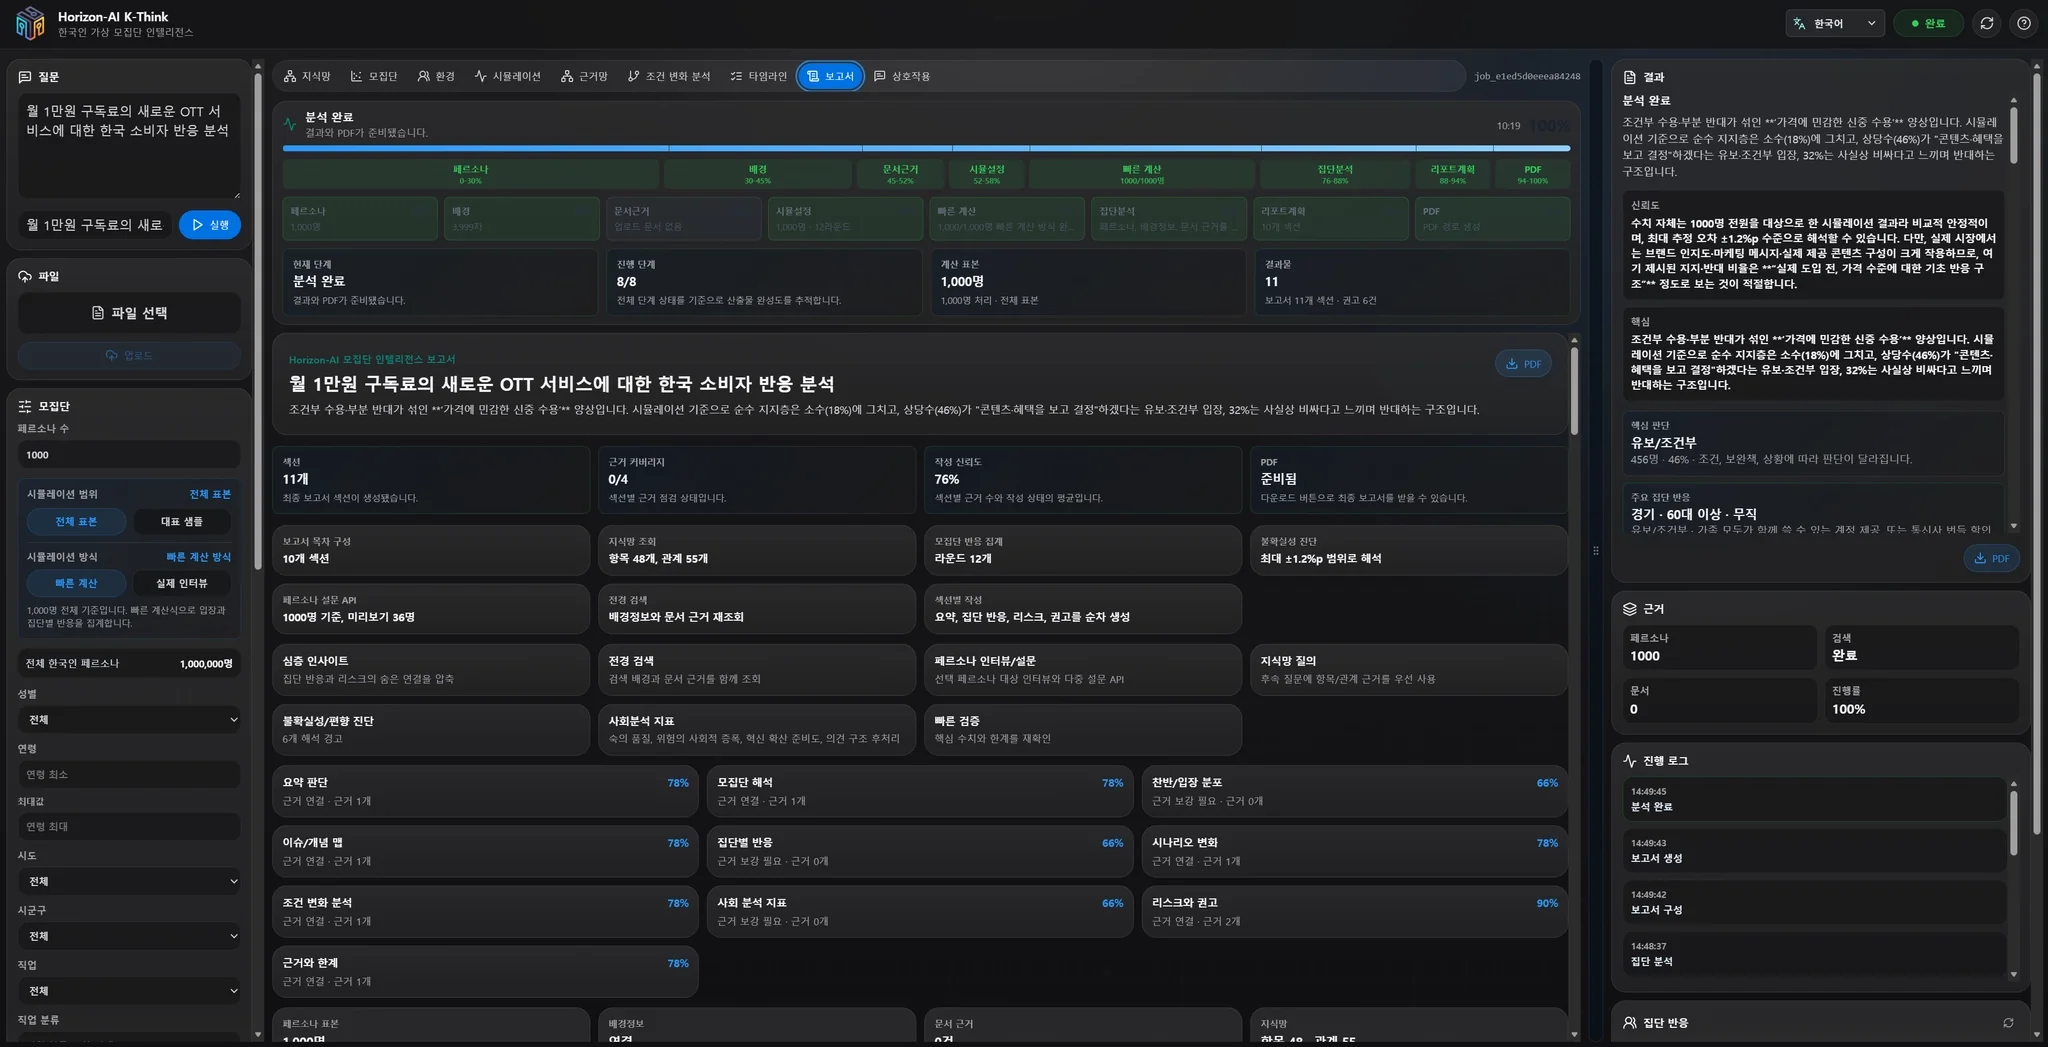
📊 Analysis Report
Summary judgment, population interpretation, position distribution, segment insights, scenario changes, What-if analysis, evidence and limitations, and execution recommendations are organized into a Korean-language report with charts and graphs. Ready to use directly for meetings, research sharing, or decision documents.
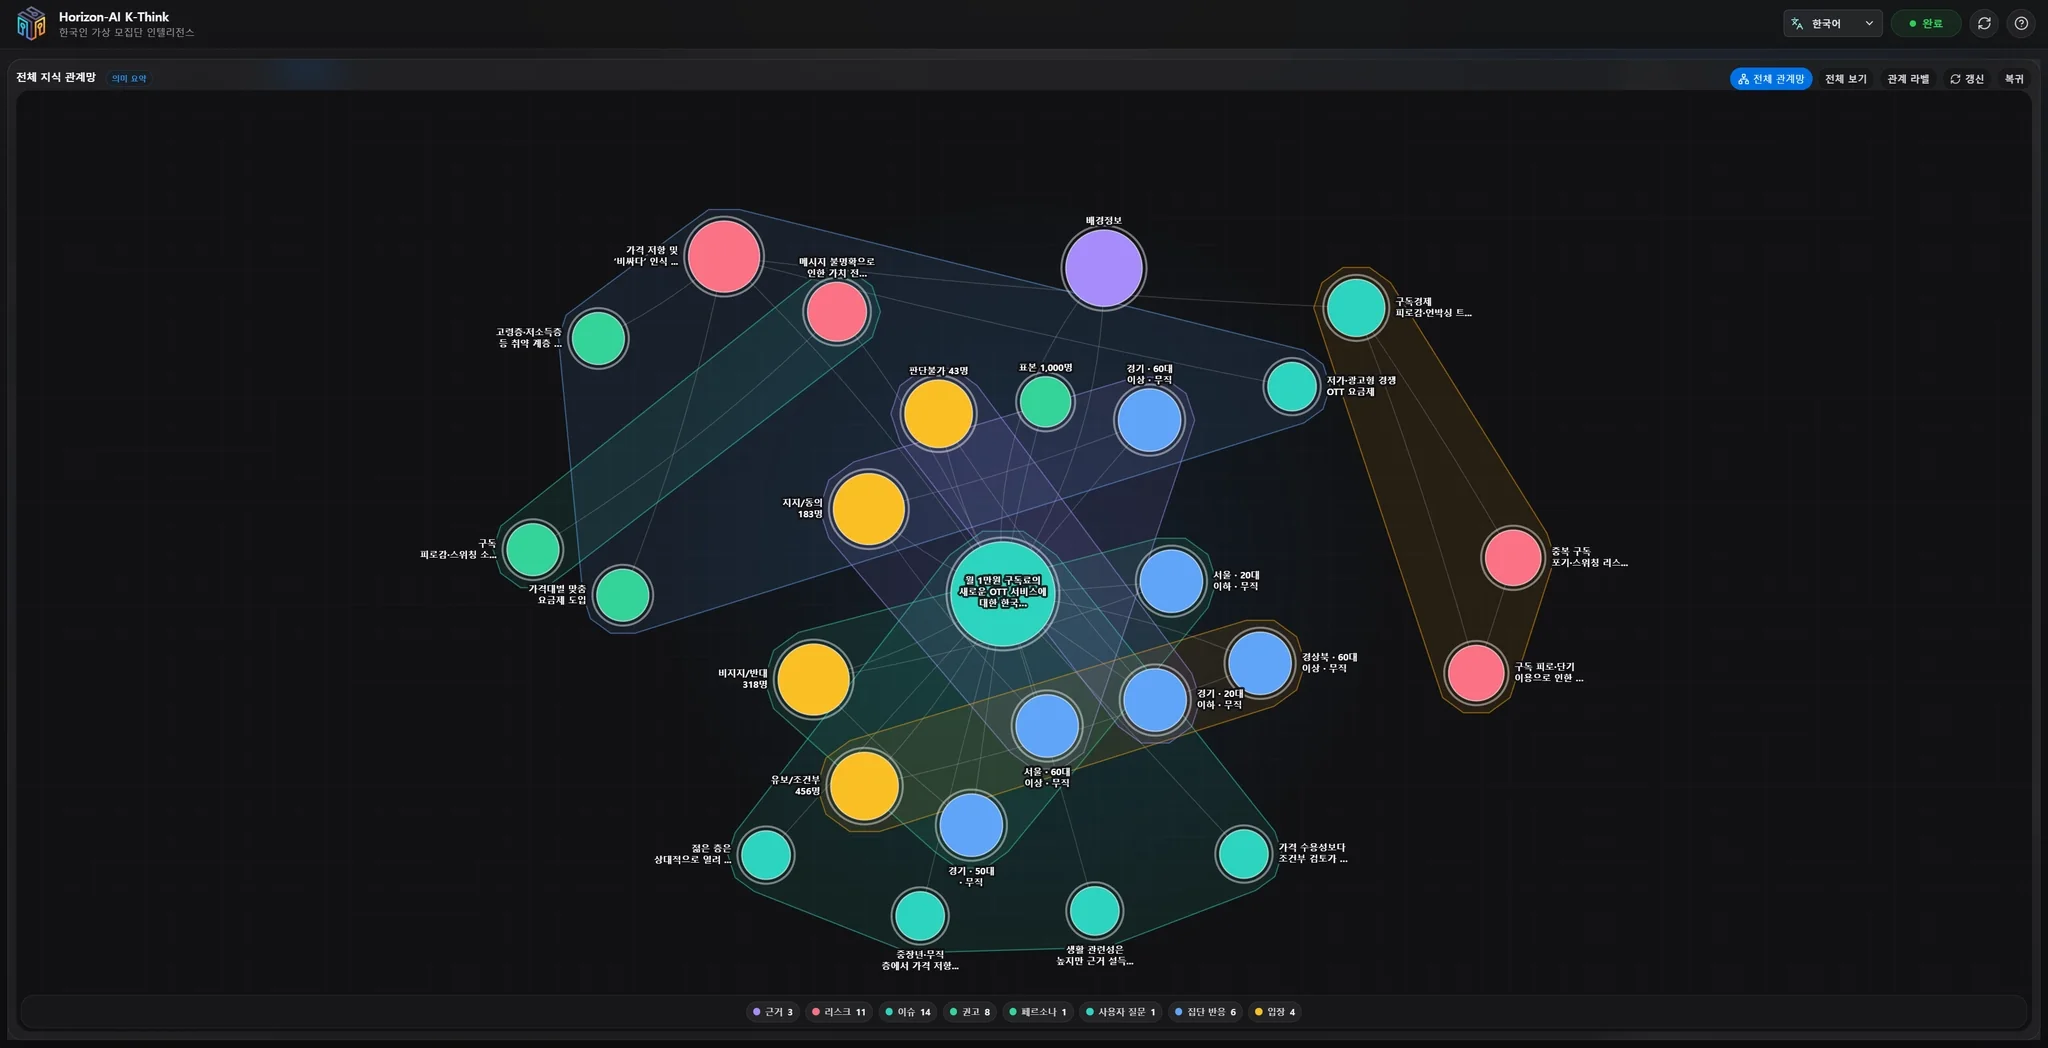
🕸 Knowledge Graph
A knowledge graph connecting questions, positions, segments, evidence, risks, recommendations, documents, and simulation results as nodes and edges. You can visually trace the evidence behind each report conclusion.
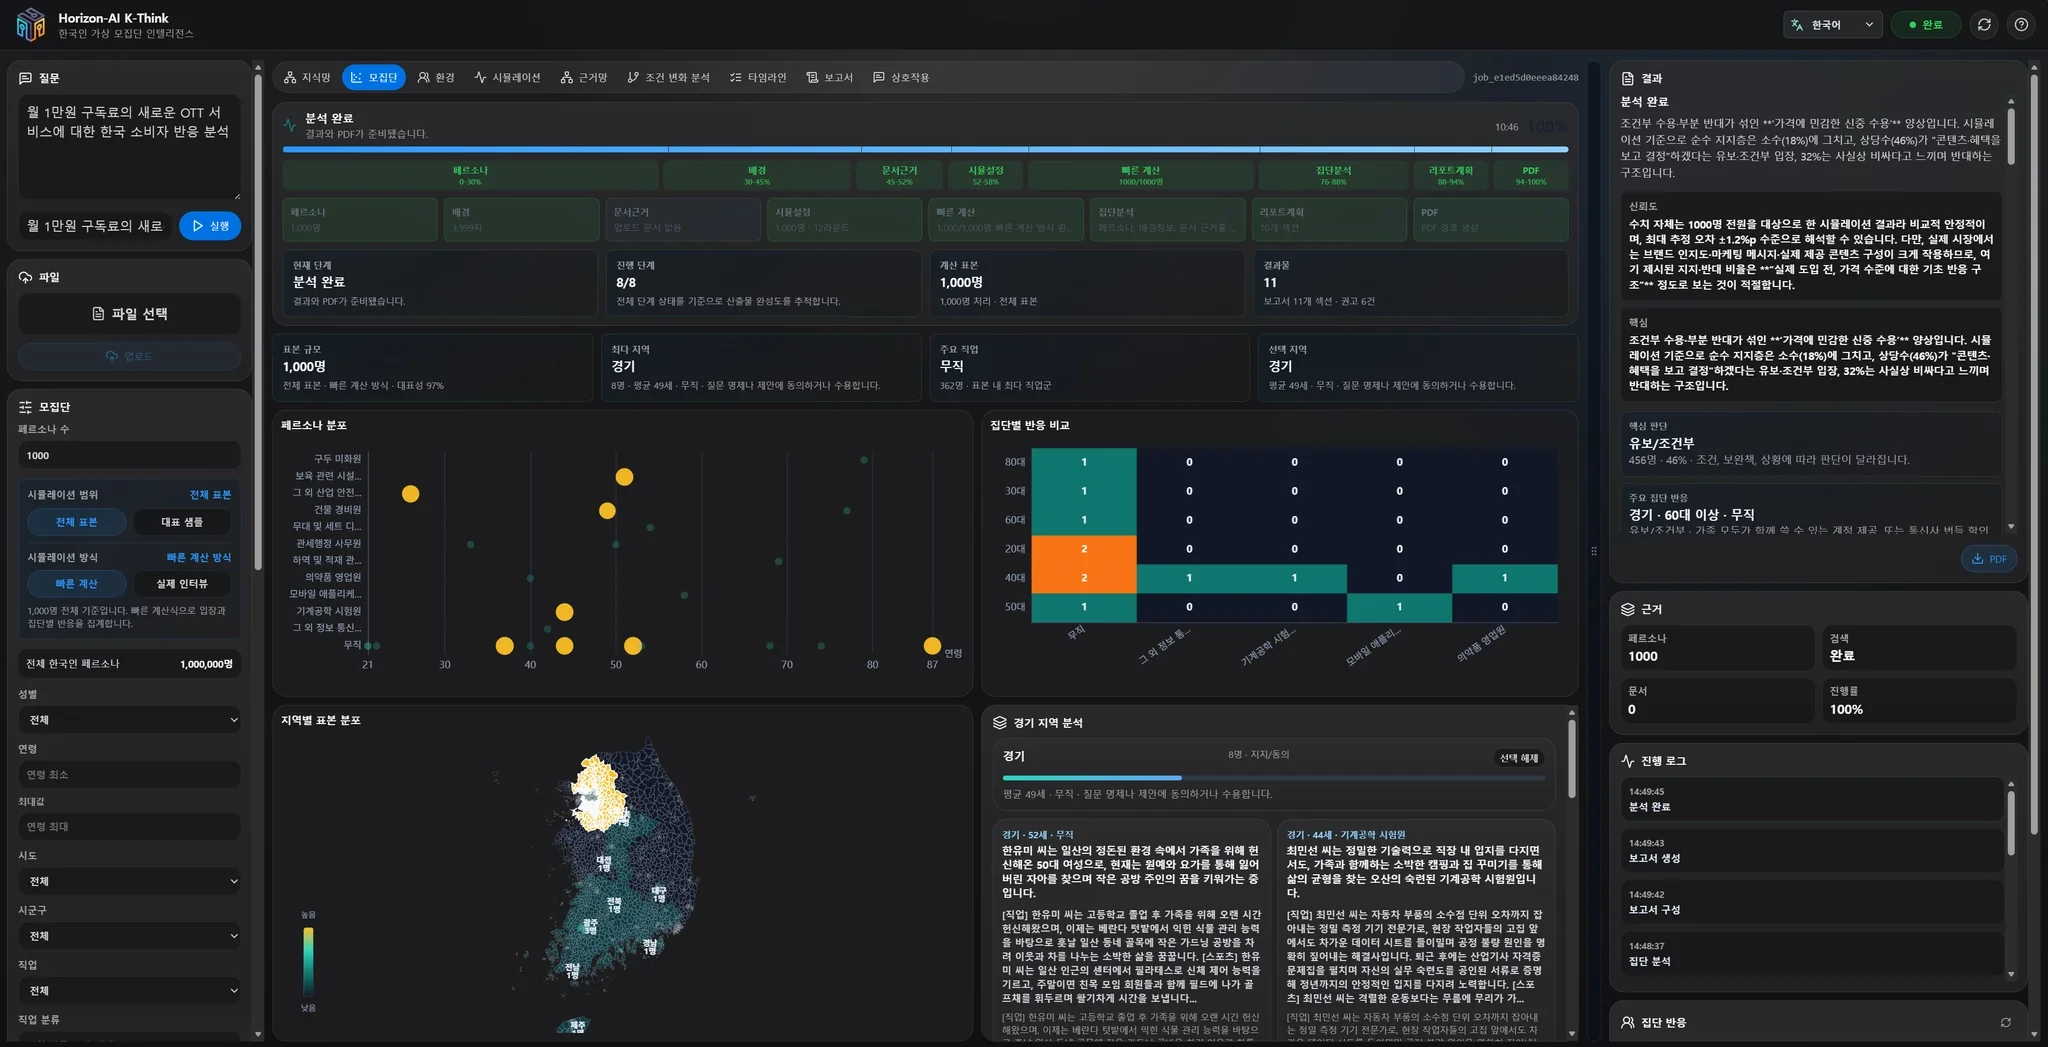
🗺 Population Choropleth
Visualizes the selected persona population by region on a map of South Korea. You can see regional distribution and reaction flow at a glance.
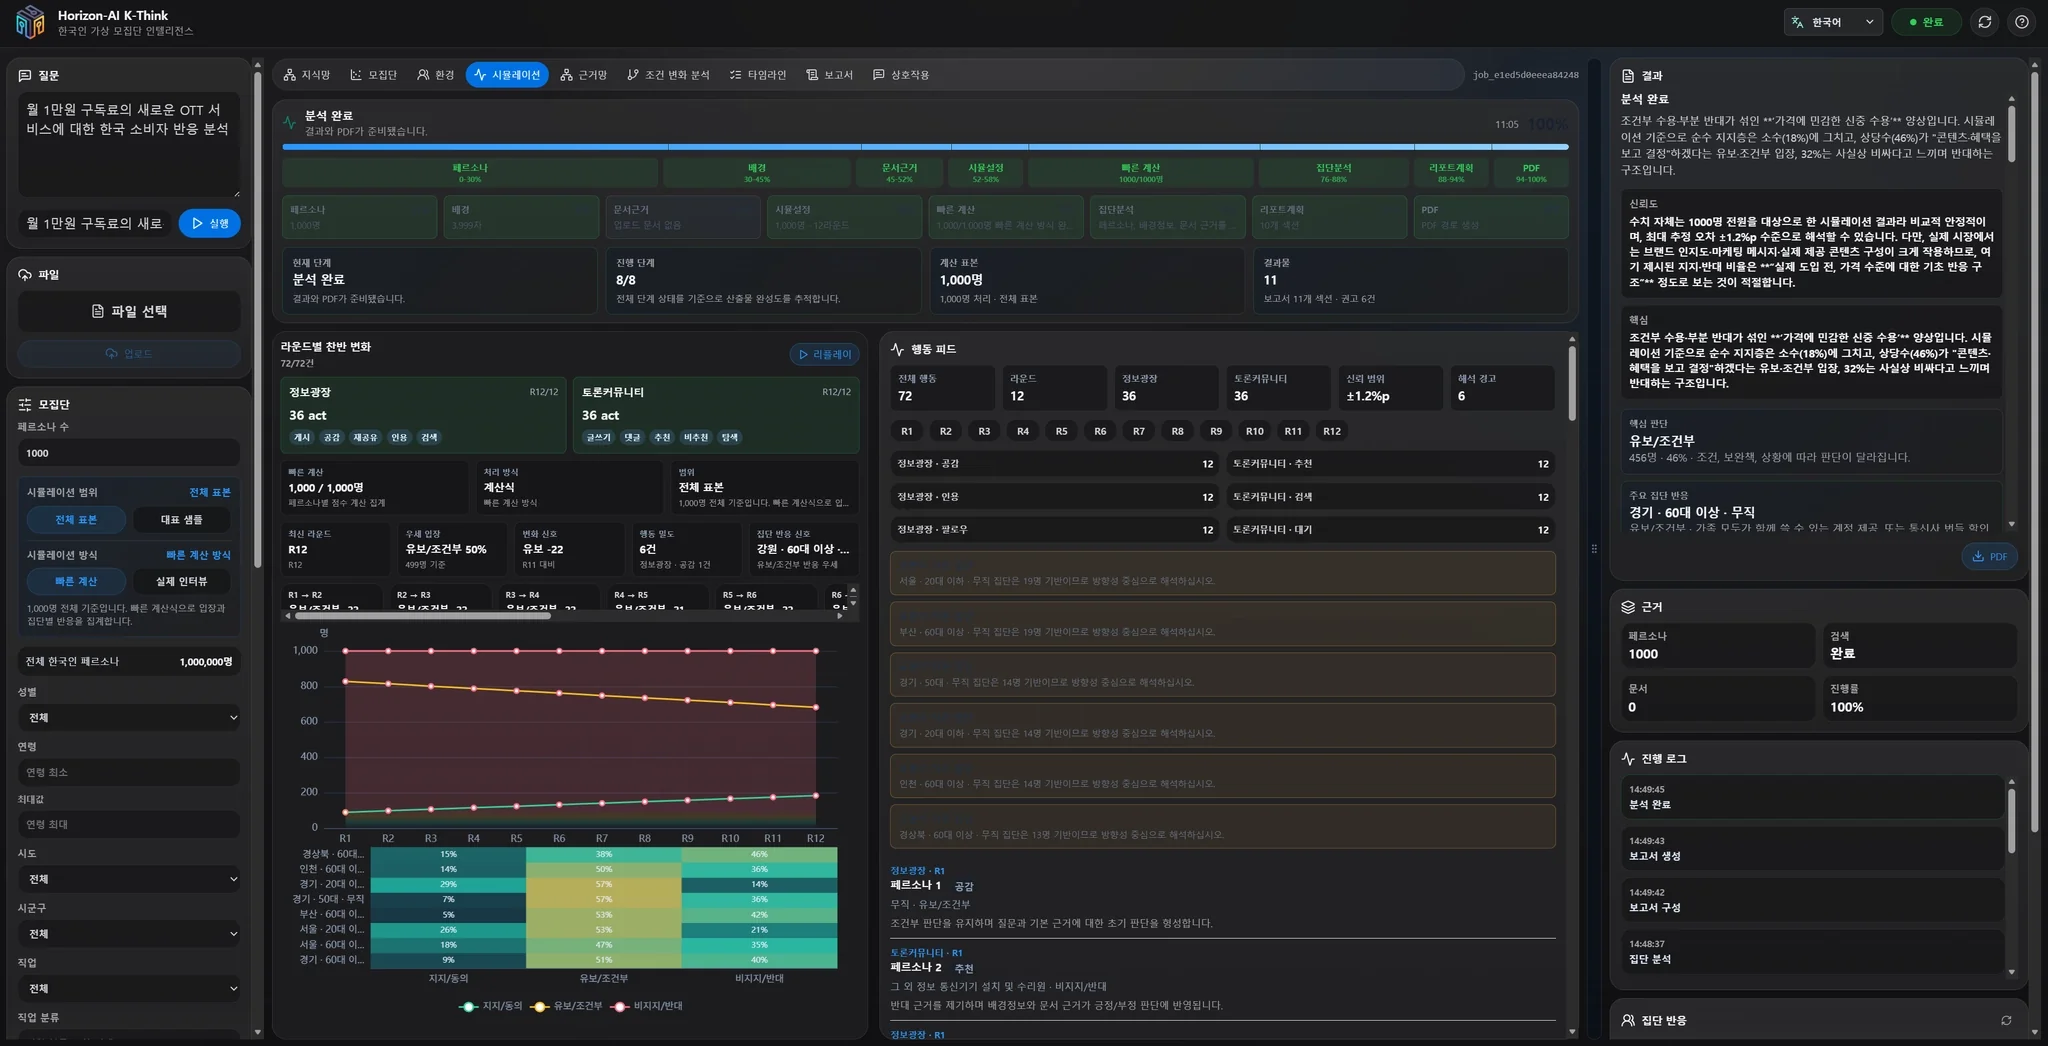
🎯 Simulation
Through round-based stages of information spread, debate, counterarguments, and convergence, it shows how support, opposition, and neutral flows and segment reactions change over the time axis.
🔗 Evidence Network
A network visualizing relationships between the evidence used in the analysis. You can check which evidence supports which positions.
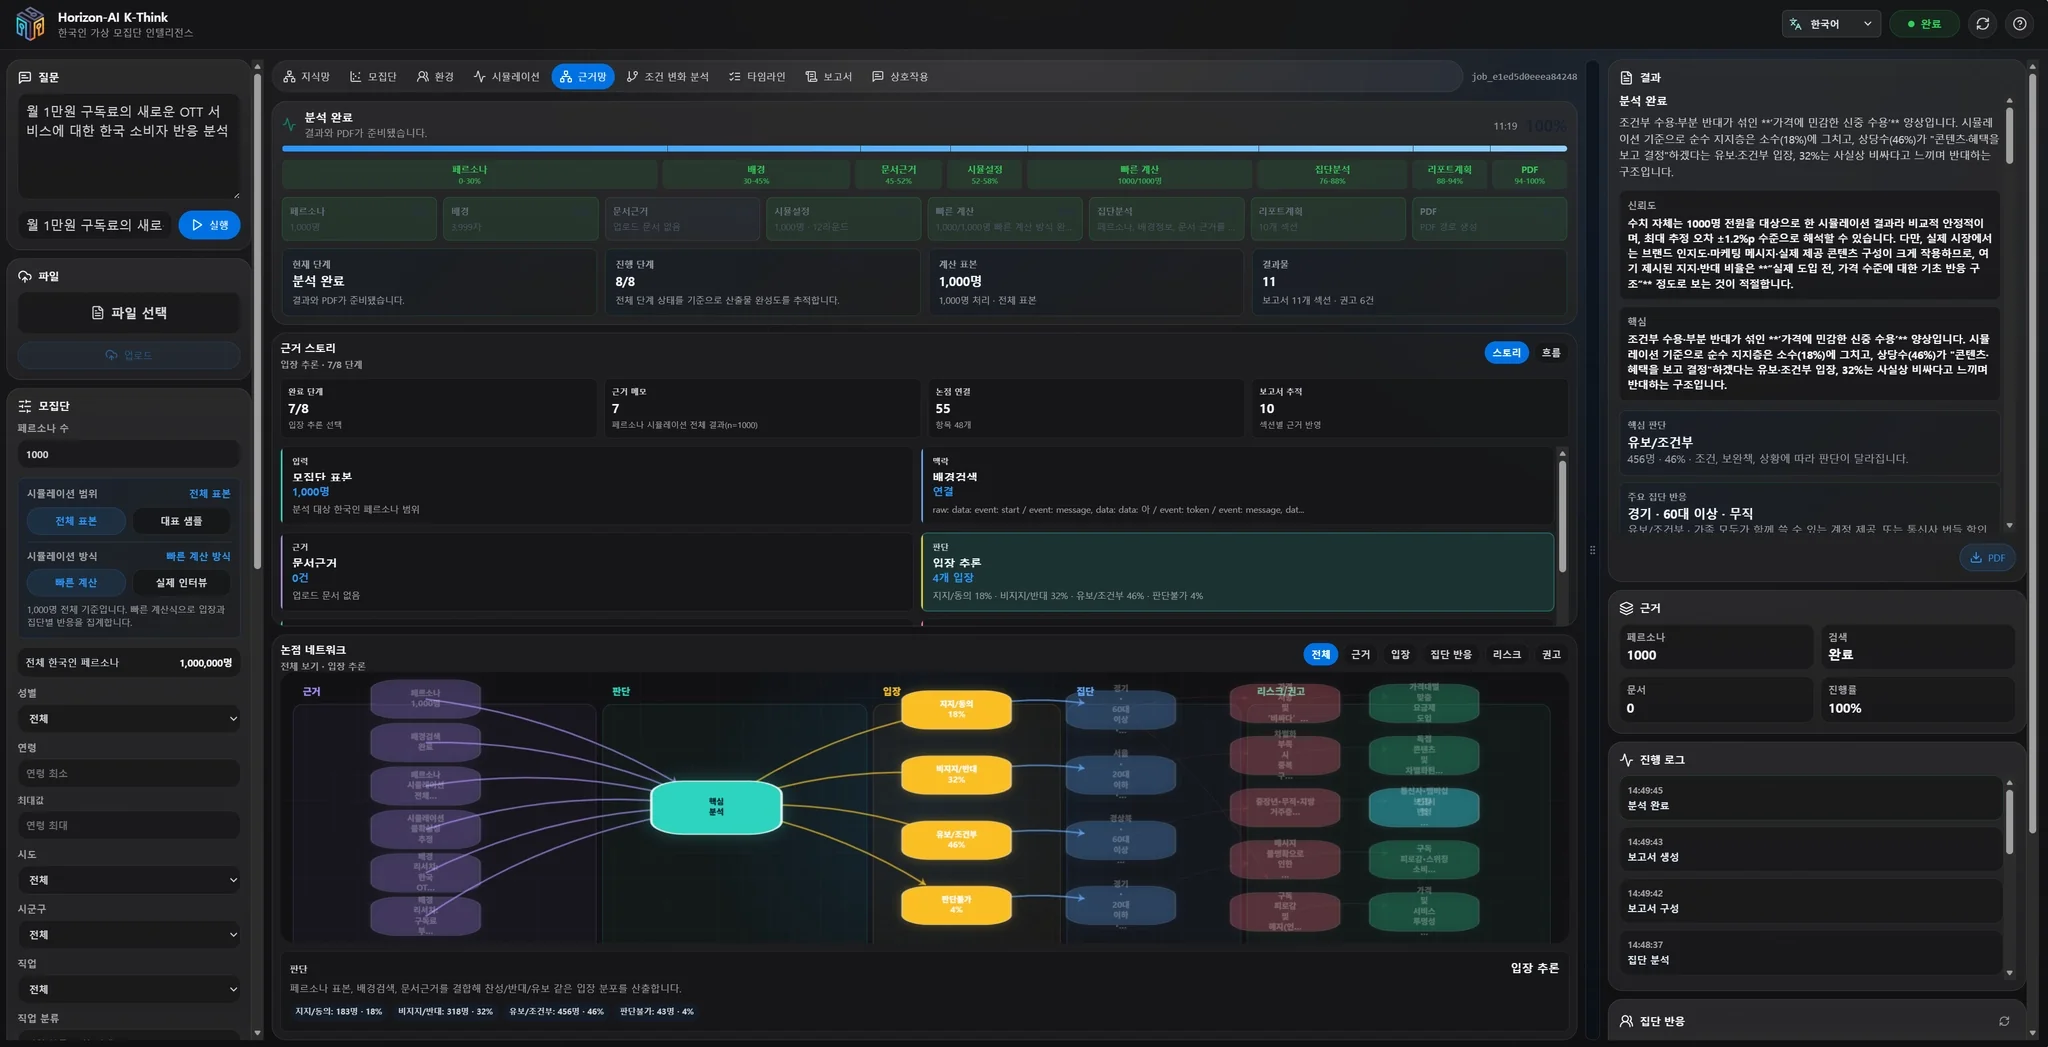
💬 Interaction
An interaction view showing information exchange and discussion flow between personas. You can trace how collective decision-making is formed.
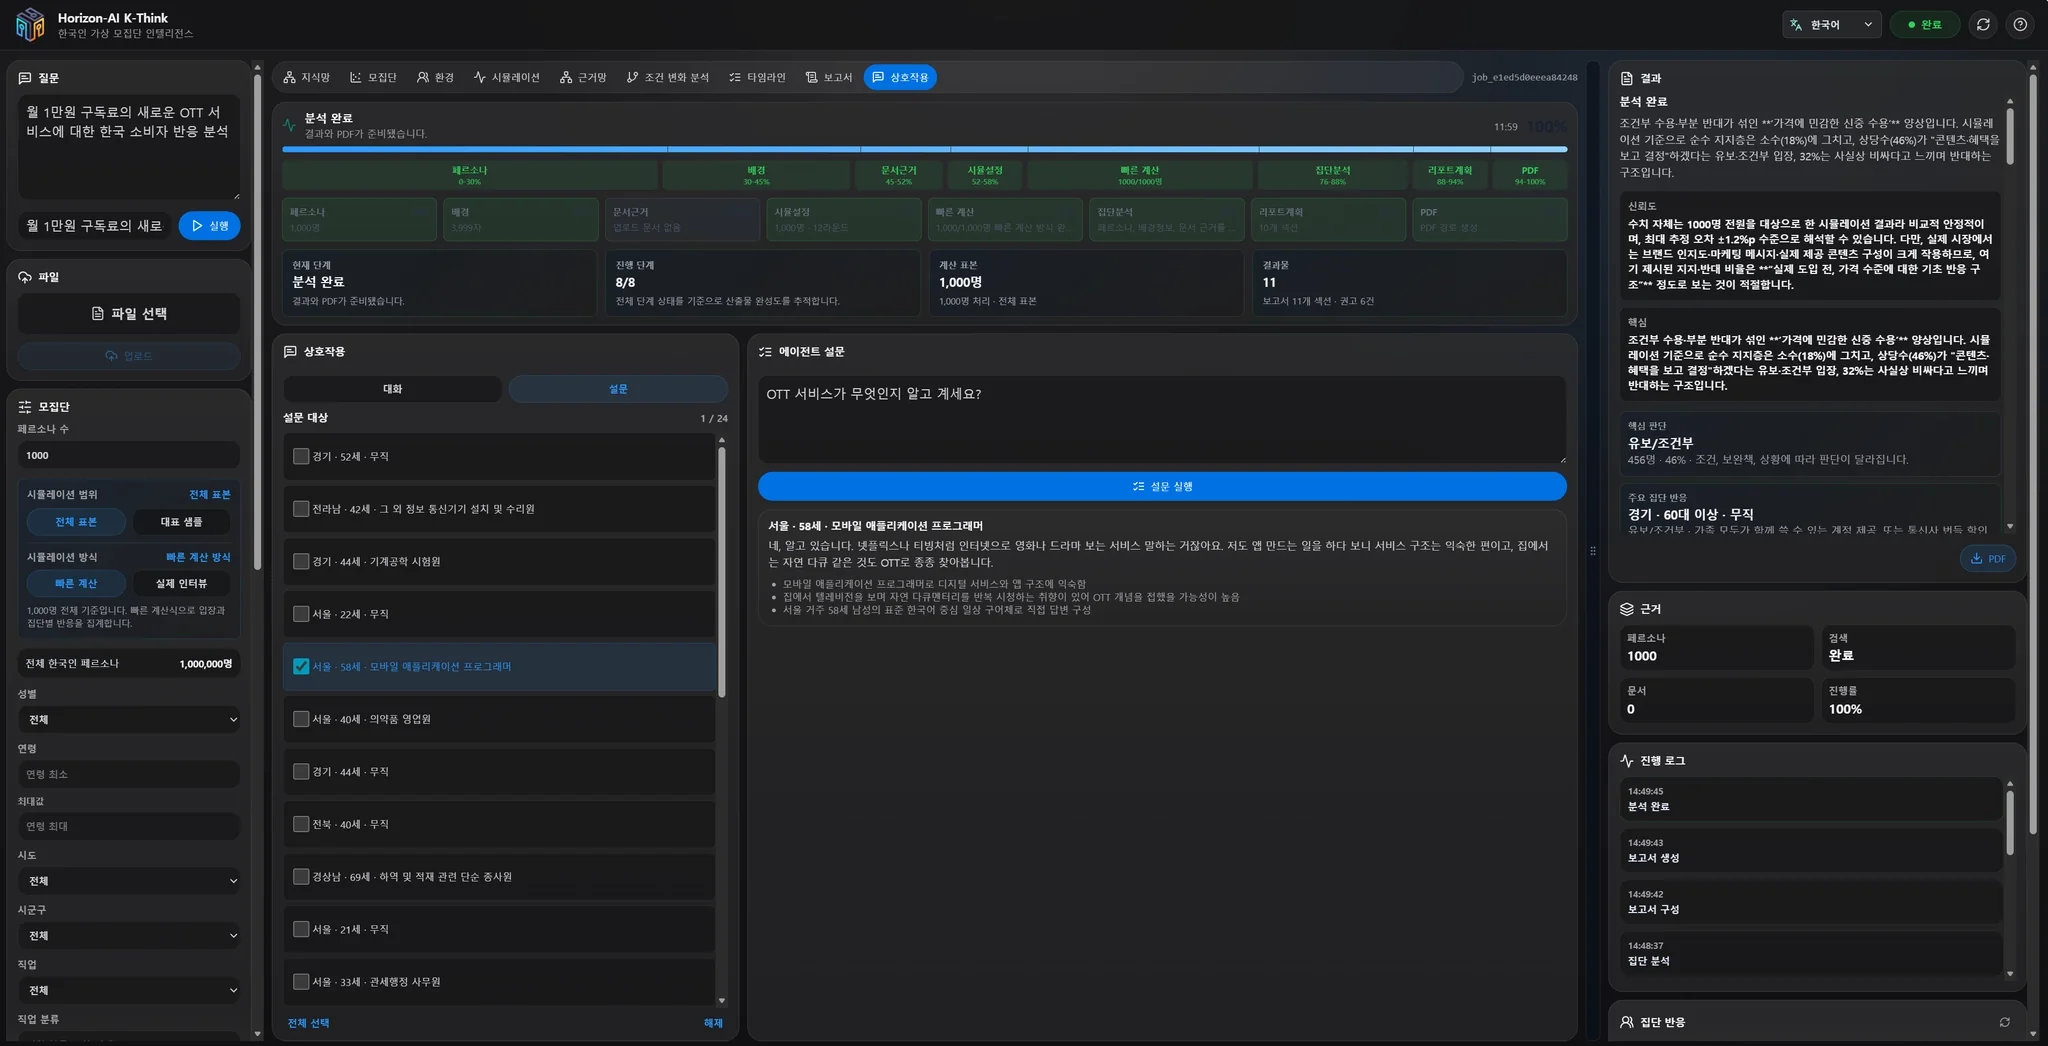
💾 Saving Your Work to VORA
The analysis screen opens in a new tab, and the link expires after 1 hour. Save your analysis to VORA with the [EXPORT VORA] button on the Report tab or the Results tab on the right.
Saved files are collected under Settings > My AI Generated Files, and they stay there even after you delete the chat or the link expires.
📁 What is My AI Generated Files?
It's the space where the images, documents, and videos created while using your AI are stored. (Settings > My AI Generated Files)
- Results created in a chat expire after a while, but files saved here stay available
- Deleting a chat does not delete the files you've saved here
- Storage is capped at 200MB. Once it's full, new files can't be saved — clear out what you no longer need
※ This is different from AI Knowledge Base. AI Knowledge Base is where you upload your own documents for your AI to read and refer to when answering. My AI Generated Files is the opposite — it's where the results your AI creates are collected.
Practical request checklist
For a stronger K-Think Opinion Simulator request, state the goal, input, scope, and output format together. Adding one more layer of constraints beyond the basic examples reduces follow-up questions and makes the result easier to use.
- Define the topic, population or persona, and decision question.
- Set assumptions, dates, region, comparison scenarios, and supporting evidence.
- Request a base/upside/downside structure and an explicit account of uncertainty.
Review, save, and reuse the result
Treat the K-Think Opinion Simulator result as a draft or a snapshot taken at query time. Check the following before carrying it into the next task.
- Separate observed facts from assumptions, estimates, and conclusions.
- Change key assumptions and compare how sensitive the conclusion is.
- Treat fortune, personality, public-opinion, and strategy outputs as exploratory simulations, not certain predictions.